Tutorial: Managing Queries
This self-service tutorial guides you through a more advanced task: Monitoring and managing of longer running queries.
Difficulty: Advanced
Time needed: 4 hours
Introduction
After setting up an Okera cluster and configuring it according to the Cluster Sizing guidelines, a common challenge around operating such Okera clusters is the question of how to manage long running queries. This short tutorial introduces you to the necessary resources provided by the Okera services and then presents a specific approach on how to use them for the aforementioned purpose.
Useful Cluster Information
Please refer to the Architecture Overview for details on the services provided by an Okera cluster.
For this tutorial, we will focus on two of them, namely the Okera Policy Engine (planner) and the Okera Enforcement Fleet (workers).
Both of those expose an internal, web-based management service, commonly available on port 11050 for the Policy Engine, and 11051 for the workers.
Note: These ports are usually not exposed as public endpoints for services. You will need to access them locally or enable access as needed.
The Policy Engine has a tab on that page named /membership, which provides the list of all currently known worker nodes (among other things):
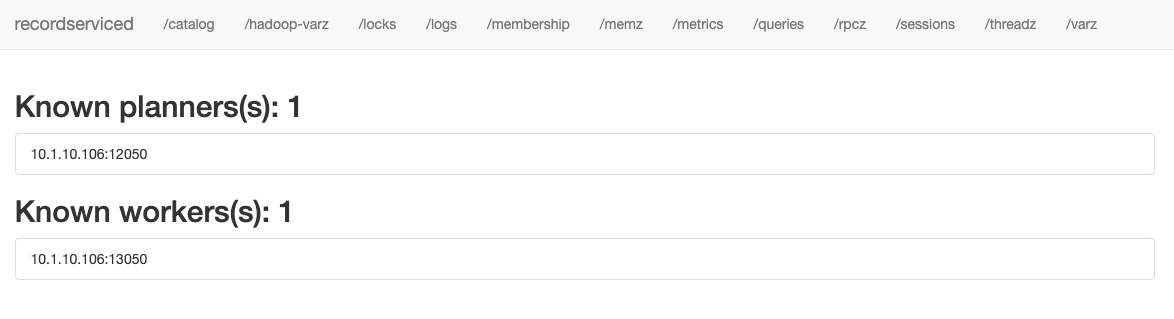
|
For the workers, the web pages look very similar to the Policy Engine's, but have slight differences in the number of available tabs, as well as what is displayed on them.
Most notably, the /queries tab for the workers shows the running queries:
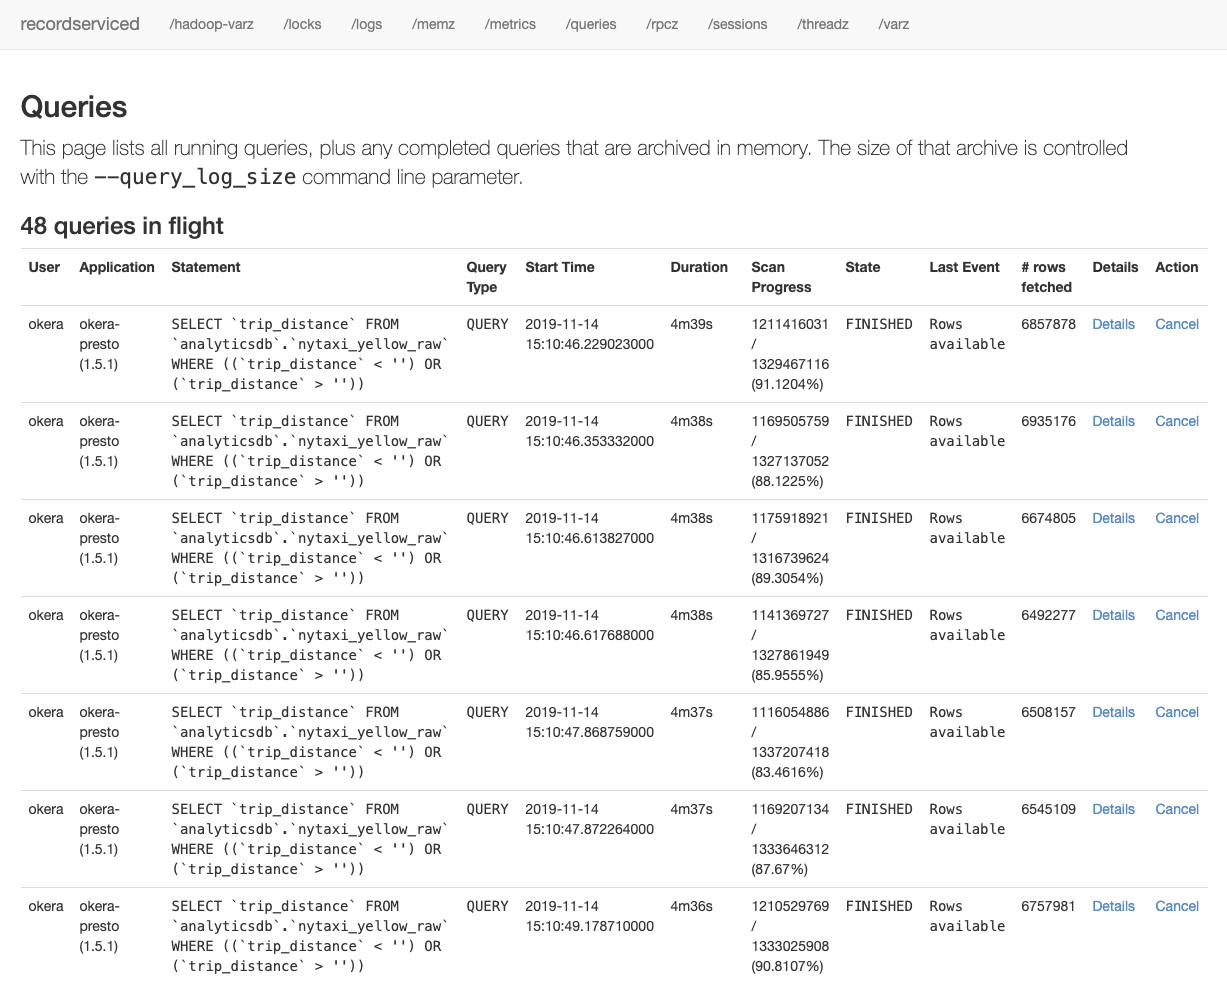
|
The Policy Engine, while also having a /queries tab, does not show running queries, since the purpose of the Policy Engine service is to plan queries, not execute them.
In particular, the task of planning includes a step where the query is parallelized into many tasks, which are similar to the original query, but operate on a subset of the data.
These tasks are then executed across the cluster by the available workers, and are what is listed on the /queries tab.
The example screenshot above shows a list of queries in flight, which are really separate tasks of the same original query.
They are already in the state FINISHED, waiting for the client to collect the results.
Monitoring and managing queries is then a three step process:
-
Determine the worker nodes - this is needed to be able to communicate with each to manage the running tasks.
-
Get the list of in-flight queries for each worker.
-
Terminate the queries (tasks) that exceed a certain threshold.
Management APIs
For step #3, you can use the workers /cancel_query?query_id=${qid} endpoint and query ID parameter, instructing the server to terminate a particular task.
The JSON returned by the /queries?json endpoint (which is the same as used earlier in the browser screenshot, but with the added ?json parameter) contains the necessary details, including the query_id and duration:
...
"in_flight_queries": [
  {
    "application": "okera-presto (1.5.1)",
    "effective_user": "okera",
    "default_db": "default",
    "stmt": "SELECT `trip_distance` FROM `analyticsdb`.`nytaxi_yellow_raw` WHERE ((`trip_distance` < '') OR (`trip_distance` > ''))",
    "stmt_type": "QUERY",
    "start_time": "2019-11-14 15:52:40.201877000",
    "end_time": "00:00:00",
    "duration": "2m7s",
    "progress": "789800373 / 1328614131 (59.4454%)",
    "state": "FINISHED",
    "rows_fetched": 4644157,
    "query_id": "5b4d903384e59692:2a8657b90c942891",
    "last_event": "Rows available"
  },
  ...
Using the query ID and the cancel query endpoint allows invoking the cancellation request. Here is an example using the endpoint directly from a browser, which shows the confirmation that is returned when the cancellation was successful:
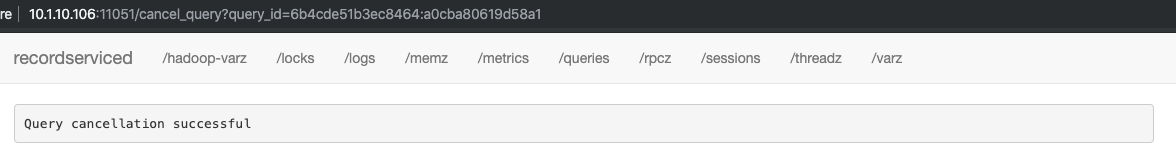
|
A client would receive an error indicating that the query cannot fetch the rows that were queued up. For example, using the PrestoDB JDBC driver to query data provided by an Okera cluster, the error stack for a cancelled query would look similar to this:
org.jkiss.dbeaver.model.exec.DBCException: SQL Error [65536]: Query failed (#20191114_155114_00028_95hx8): Unable to fetch records.
TRecordServiceException(code:INVALID_HANDLE, message:Invalid handle)
...
Caused by: com.facebook.presto.spi.PrestoException: Unable to fetch records.
TRecordServiceException(code:INVALID_HANDLE, message:Invalid handle)
    at com.okera.recordservice.presto.RecordServiceRecordSet$RecordServiceCursor.advanceNextPosition(RecordServiceRecordSet.java:171)
    at com.facebook.presto.$gen.CursorProcessor_20191114_150803_31.process(Unknown Source)
    at com.facebook.presto.operator.ScanFilterAndProjectOperator.processColumnSource(ScanFilterAndProjectOperator.java:237)
    at com.facebook.presto.operator.ScanFilterAndProjectOperator.getOutput(ScanFilterAndProjectOperator.java:229)
    at com.facebook.presto.operator.Driver.processInternal(Driver.java:379)
    ...
Automation
The cancellation process can be automated in many ways, for example, using BASH scripting. The following shows a script that implements the above process and could be run through a CRON job on a management machine.
These requirements are needed for the script to work:
-
cURL needs to be installed.
-
JQ, which is used to process JSON data, needs to be installed.
-
Access to the worker endpoints must be set up properly. This includes bypassing any optional load-balancer in front of the service.
#!/bin/bash
# Usage : ./query-terminator <planner-ip or planner-hostname>

echo "Terminating queries running for more than 1 hour"
planner=${1}

# Get list of currently active workers
curl -s http://${planner}:11050/membership?json | jq -r '.workers' | \
  tail -n +2 | head -n -1 | sed 's/\"//g' | sed 's/\:13050,//g' | \
  sed 's/\:13050//g' > workers.list

# Iterate over current worker list
while read worker; do
  echo "----------------------------------"
  echo "Worker:"${worker}
  echo "----------------------------------"

  # Get list of in-flight queries for current worker
  curl -s http://${worker}:11051/queries?json | \
    jq -r '.in_flight_queries[]' > worker.queries

  # Iterate over the in-flight queries
  jq -c '.' worker.queries | while read qrow; do
    # Analyze query info to get elapsed time
    qduration=$(echo $qrow | jq -r '.duration')
    # Check the query time against the maximum allowed one
    if [[ $(echo ${qduration} | grep -i -E '^[1-9].h') ]]; then
      # Get the query ID
      qid=$(echo $qrow |  jq -r '.query_id')
      # Kill the query using the ID
      curl -s http://${worker}:11051/cancel_query?query_id=${qid}
      # Print terminated query statement query
      echo "Terminated query: ${qid}"
      echo "$qduration"
      echo $qrow | jq -r '.stmt'
      echo "-----------------"
    fi
  done
done < workers.list

# Remove temporary files
rm -f workers.list worker.queries
Some notes concerning the script:
-
The script ignores the confirmation returned by the endpoint as it is not needed.
-
All the ports are hard-coded (like the worker RPC port), but ideally are configurable.
-
The duration is determined by comparing the time as a string, which is not as flexible as actual date/time handling.
-
Cancelled queries are logged for later analysis by an administrator.
Server-Side Settings
Besides the management API, there are other parameters an administrator could use to influence long running queries or slow clients.
These are server-side settings that need to be added to the configuration of the cluster itself, specified in the configuration YAML file using the RS_ARGS key. See RS_ARGS Options.
-
--idle_query_timeout=0The time, in seconds, that a query may be idle for (that is, no processing work is done and no updates are received from the client) before it is cancelled. If
0, idle queries are never expired. The query optionQUERY_TIMEOUT_Soverrides this setting, but, if set,--idle_query_timeoutrepresents the maximum allowable timeout. -
--idle_session_timeout=120The time, in seconds, that a session may be idle for before it is closed (and all running queries cancelled). If
0, idle sessions are never expired.
For example, in the cluster configuration YAML file, add (or amend) this line:
RS_ARGS: "--idle_session_timeout=120 --idle_query_timeout=120"
Note: These settings are cluster-wide and may have an adverse effect on other query behavior. Okera recommends you be very careful changing those settings without proper testing or professional advice. In addition, inform Okera Support of your changes to avoid any delays in later troubleshooting sessions.
Summary
With the APIs provided by the Okera processes you can check the currently running queries and implement a safeguard against runaway tasks. The shown Bash script should just serve as a starting point, as more checks could be added to make it more robust.